

Where seniors are most (and least) likely to outlive their savings


-Seniors in 41 States and D.C. Projected to Outlive Savings
-Seniors Most Likely to Outlive Savings in New York, Biggest Surpluses in Washington
Older adults in nearly every state can expect to outlive their retirement income and savings, according to a new CareScout analysis.
The average 65-year-old is staring down a $109,000 hole – the difference between what they're likely to spend in retirement and what Social Security, savings and investments are projected to cover. Seniors in 41 states and Washington, D.C., are facing a shortfall, while only nine states leave older adults with enough money to cover their golden years.
The findings come as retirement becomes a bigger source of financial anxiety across the country. Americans now believe they need $1.46 million in the bank to retire comfortably, according to Northwestern Mutual – $200,000 more than a year ago. What’s more, 40% of Baby Boomers and 50% of Gen Xers now think they could outlive their savings.
Rising prices for housing, healthcare, food and other basics can chip away at even the most carefully built nest eggs. What looked like enough money at 65 may run thin by 75, and one bad year can upset the whole equation.
 Retirement savings aren’t safe from financial shocks, either. Over the past year, 8% of non-retired adults have tapped their retirement savings to cover other expenses, according to the Federal Reserve.
Where you live matters. States with lower costs give retirees more breathing room, making it easier to stay financially stable well into old age. In pricier states, that same pool of savings can evaporate surprisingly fast.
CareScout analyzed where older adults are most and least likely to outlive their savings. Using the latest available data on life expectancy at age 65, Social Security income, household net worth, and cost-of-living metrics, we estimated how far seniors’ financial resources are likely to stretch over a typical retirement in each state. More details are included in the methodology below.
 The results reveal sharp geographic divides, and show where seniors stand the best chance of making their money last.
In this report, a positive cushion means retirees in that state, on average, have enough income and assets to cover their expected expenses. A negative number signals a likely shortfall, with seniors at greater risk of outliving their financial resources.
There have been some changes since Seniorly, acquired by CareScout, first conducted this analysis in 2025. Older adults in New Hampshire, Nebraska and Idaho could previously expect to run out of money in retirement, but now it’s more likely that they will have financial cushions. Meanwhile, seniors in Iowa, Kansas and South Carolina are now more likely to outlive their savings than to pass anything on. Those shifts are mostly tied to the U.S. Census Bureau’s estimates on median household net worth, which increased or fell dramatically in some states year-over-year.
Take a look at the in-depth findings below.
Key Findings
The average 65-year-old is facing a shortfall: Over a typical retirement, American seniors are expected to bring in nearly $788,000 from Social Security, savings and investments – but they’ll spend about $897,000 on necessities, a deficit of $109,000.
Seniors in 41 states and D.C. are projected to outlive their savings, while only nine states will have a financial surplus over their retirement years. These states span the country, but they tend to have much higher senior incomes and longer life expectancies for older adults.
New Yorkers have the biggest gap: With $711,868 in expected income from Social Security, savings and investments – but projected expenses of more than $1.18 million during retirement. That’s a shortfall of $471,000.
Washington’s seniors have the biggest cushion: They are expected to spend $1.02 million on essentials over their golden years, but will hold nearly $1.3 million from Social Security, savings and investments – a surplus of about $276,000.
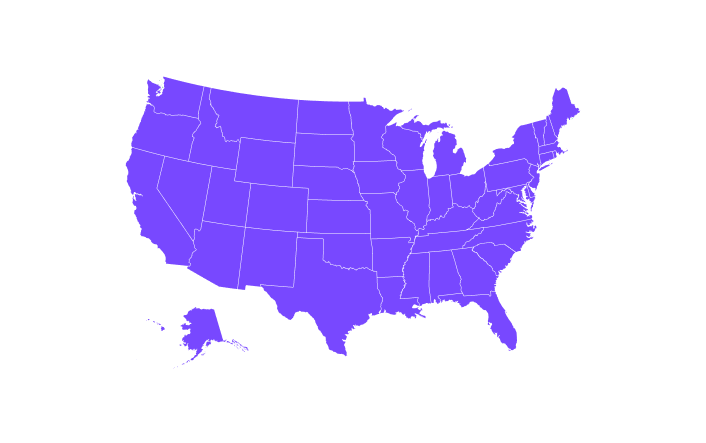
Where Seniors Are Most Likely to Outlive Their Savings
Some states present a steep uphill climb for retirees. New York has the bleakest outlook of any state, with seniors facing a projected shortfall of $471,000. The income picture is modest – retirees can expect to bring in around $712,000 – but lifetime expenses push past $1.18 million over nearly 20 years of expected retirement.
No. 2 Washington, D.C. and No. 3 California aren't far behind, with shortfalls of $432,000 and $395,000 respectively, driven by some of the highest living costs in the country. Rounding out the bottom five are No. 4 Alaska and No. 5 New Mexico, where housing, healthcare, and other everyday expenses put serious pressure on retirement savings.

Where Seniors Are Least Likely to Outlive Their Savings
Some states give retirees a real fighting chance. Washington ranks first overall, with seniors projected to come out $276,000 ahead – a cushion built on strong retirement income of nearly $1.3 million paired with expenses that, while substantial at just over $1 million, don't outpace what retirees bring in. No. 2 New Hampshire tells a similar story, with a $240,000 surplus due to retirement income topping $1.24 million but expenses landing around $1 million.
Meanwhile, seniors in No. 3 Colorado, No. 4 Nebraska and No. 5 Idaho have financial cushions of $188,000, $145,000 and $112,000, respectively. These states share a combination of solid incomes and costs that don't swallow them whole, giving seniors a realistic shot at financial stability through their later years.

Where Seniors Have the Biggest Nest Eggs
Hawaii's retirees have the largest projected income in the country at $1.73 million, a number that still can't keep up with the state's staggering cost of living.
Washington and New Hampshire, where seniors can expect surpluses, follow with projected incomes of $1.3 million and $1.24 million, while Colorado, Maryland, New Jersey and Idaho also clear the $1 million mark. Notably, however, so does Massachusetts – a reminder that high earnings alone don't guarantee a comfortable retirement once expenses enter the picture.
At the other end of the spectrum, seniors in Arkansas and Kentucky face retirement on projected incomes of just $490,000 and $521,000, respectively, the lowest levels in the country. Mississippi, Oklahoma, Louisiana, New Mexico, Alabama and West Virginia are all near the bottom as well, with incomes below $580,000 – leaving little margin for unexpected costs.

Where Seniors’ Cost of Living is Highest
We measured seniors’ expected spending on essentials like housing, groceries, transportation, and healthcare, adjusted for the cost of living in each state.
Hawaii is the most expensive place in the country to retire, with projected lifetime expenses of nearly $1.79 million. Massachusetts and California aren't far behind, with estimated costs of $1.39 million and $1.34 million – reflecting the relentless price of housing, healthcare and daily essentials in those states.
On the flip side, Oklahoma and Mississippi offer the most affordable retirements, with lifetime expenses coming in under $685,000. Nebraska shows what the sweet spot can look like: total costs around $824,000, with projected income well above that threshold. It’s the lowest-cost state where seniors can still expect a financial surplus.
These gaps show how powerfully location shapes the retirement equation, sometimes more than how much a person actually saved.

Year Over Year Changes
Check out how your state’s ranking changed over the past year.
5 Ways to Make Location Work in Your Favor in Retirement Planning
Research care costs before you commit to a location. The cost of assisted living, nursing homes and in-home support varies enormously from state to state – sometimes by tens of thousands of dollars a year. Before settling on where to retire, look up what care actually costs in that area, not just what housing or groceries cost.
Don't assume staying put is always the safest option. It can feel like the right move to age in the home you know, but if you're in a high-cost state with limited care options nearby, moving closer to family or to a more affordable region earlier in retirement could give you significantly more choices down the line.
Look at the local care landscape, not just the price tag. Affordability means little if quality providers are scarce. Speak with an expert to map out your actual options, including cost and the quality and availability of providers near you.
Factor long-term care into your retirement location the same way you'd factor in taxes. Most people moving to Florida or Texas are thinking about income tax. Few are thinking about what memory care costs there in 20 years – but they should be part of the same conversation. Consider paying into long-term care insurance during your peak earning years for additional peace of mind and to protect any inheritance you plan to pass down.
Make a plan while your options are still open. The earlier you think about where you want to retire – and what your care might cost as you get older – the more control you retain. Waiting until a health crisis forces the decision often means fewer choices, higher costs and more stress for everyone involved.
Conclusion
Where you live can play a major role in whether you and your loved ones have a comfortable retirement or a financially stressful one. These days, pairing smart financial habits with an honest look at where you live, or where you plan to spend your golden years, may be the most underrated move in retirement planning.
Methodology
To determine where seniors are most and least likely to outlive their savings, we analyzed the latest available data across a range of economic and demographic indicators.
First, we used state-level life expectancy at age 65 (Centers for Disease Control and Prevention) to estimate how many years seniors are likely to spend in retirement. We then calculated expected retirement income over those years, combining average annual Social Security benefits (Social Security Administration) with median net worth, including financial assets and retirement account savings (Census Bureau).
For a few states where median net worth data wasn’t available, we used the national average net worth of $191,100. We also adjusted median household net worth for seniors to reflect that typical senior households hold about 80% more net worth than the national average household, based on Census data. We included home equity in net worth calculations to account for assets that seniors may opt to sell to help cover their retirements.
To estimate expected retirement expenses, we started with seniors’ average spending on essentials like housing, groceries, transportation, and healthcare across the U.S. (Bureau of Labor Statistics), then adjusted these figures for each state’s cost of living (Missouri Economic Research and Information Center). This gave us a realistic picture of how much seniors are likely to spend annually in each state.
By comparing projected income with projected spending over their expected remaining years, we identified which states give seniors the best chance of covering their retirement – and where they are most at risk of outliving their savings under current economic conditions.
Written by


Christine Healy
Christine Healy is the Head of Brand at CareScout. A growth strategist with over two decades of experience, Christine specializes in scaling mission-driven organizations across aging care, early education, and educational travel. She has previously held executive marketing roles at Bright Horizon...